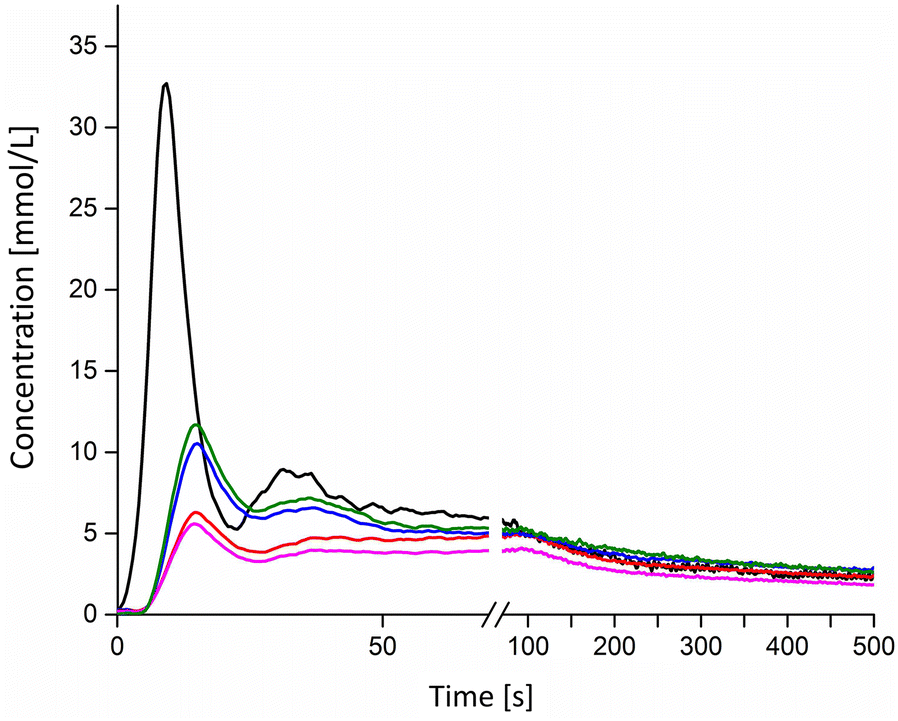
Fig. 6

Representative propagation of the bolus track during the examination of one dog. The blackline represents the propagation of the concentrations of contrast medium through the aorta, the red line shows the concentration of contrast medium in the left kidney, the magenta line the right kidney, the blue line the left cortex and the green line the right cortex. The second maximum could be noticed mainly in the aorta and not clearly be identified in the ROIs placed over the kidneys and cortices
